
Fig. 2.
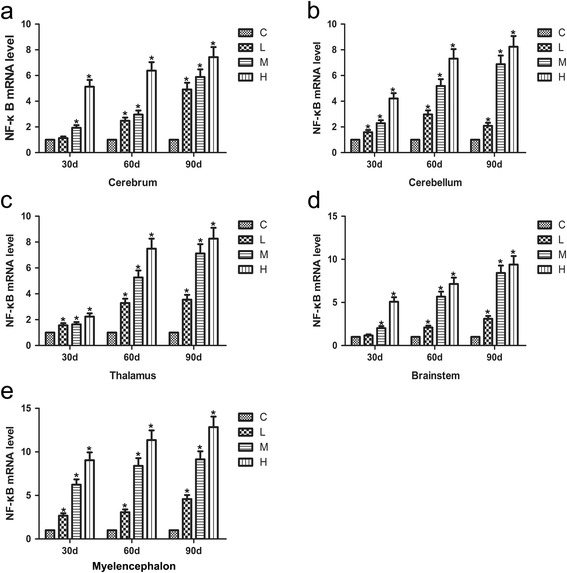
Effects of As2O3 on the NF-κB mRNA levels in the brain tissues. a-e represented the NF-κB mRNA levels in the cerebrum, cerebellum, thalamus, brainstem and myelencephalon tissue, respectively. Each value represented the means ± SD of six individuals. The bars with a star at the same sampling time were significantly different (P < 0.05)