Fig. 3.

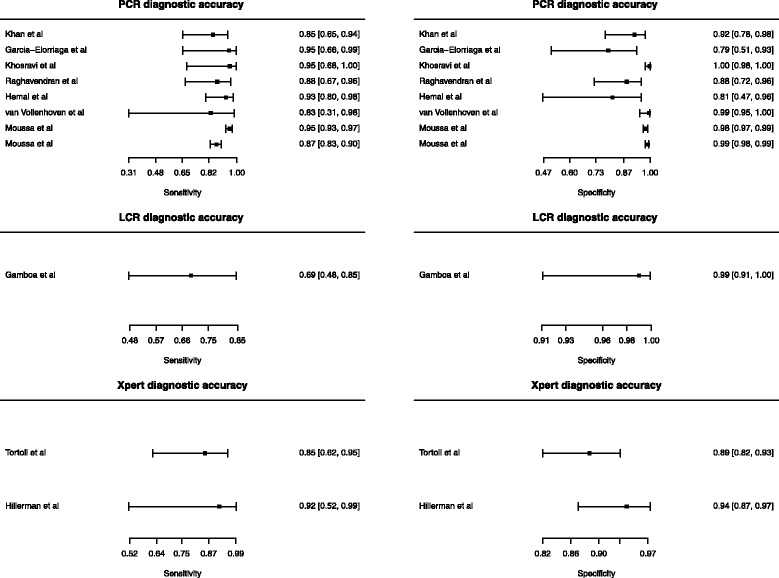
Forest plots of the diagnostic accuracy of PCR, LCR and Xpert MTB/RIF for the diagnosis of GUTB. Each triangle represents a study in the meta-analysis and the circle the summary estimate. The light line is the confidence interval

Forest plots of the diagnostic accuracy of PCR, LCR and Xpert MTB/RIF for the diagnosis of GUTB. Each triangle represents a study in the meta-analysis and the circle the summary estimate. The light line is the confidence interval