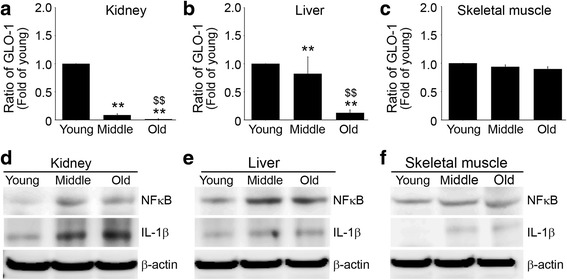
Fig. 4.

Age-related changes in the levels of GLO-1 in kidney, liver and skeletal muscle. Levels of Glo-1 in a kidney, b liver and c skeletal muscle of the young, middle-aged, and old groups were validated by qRT-PCR. Ratios in graphs represented fold levels versus young mice. Expressions of NFKB and IL-1β were determined by immunoblotting in d kidney, e liver and f skeletal muscle. **; p < 0.01 versus young mice, $$; p < 0.01 versus middle-aged mice
