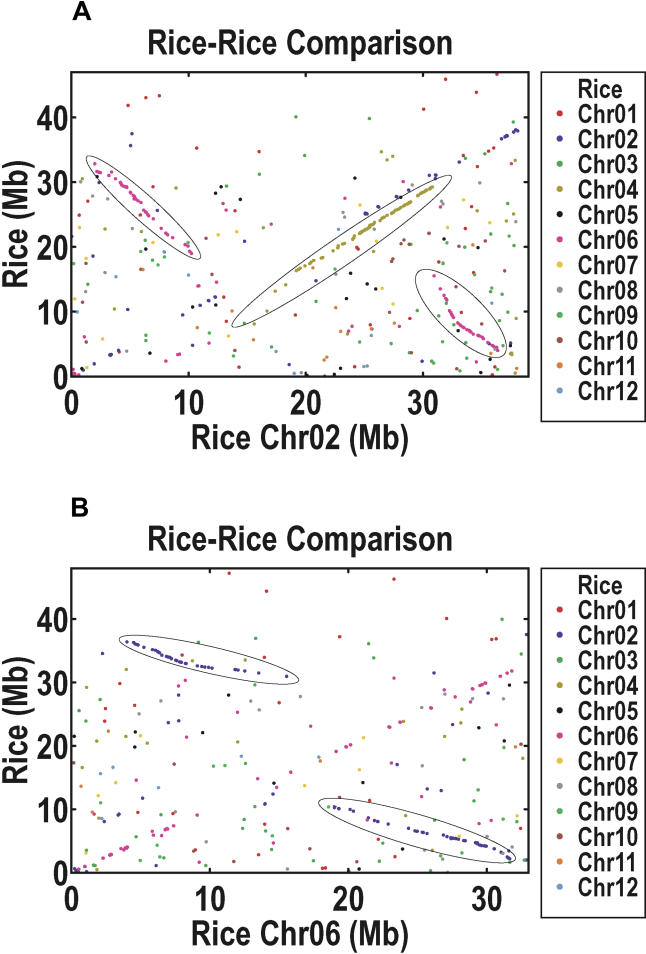
Figure 6. Duplicated Segments in the Beijing indica Assembly.
Depicted here are the plots for Chromosomes 2 (A) and 6 (B). Each data point represents the coordinated genomic positions in a homolog pair, consisting of one nr-KOME cDNA and its one and only TBlastN homolog in rice. Shown on the x-axis is the position of a gene on the indicated chromosome, and shown on the y-axis is the position of its homolog on any of the rice chromosomes, with chromosome number encoded by the colors indicated on the legend at the right.

