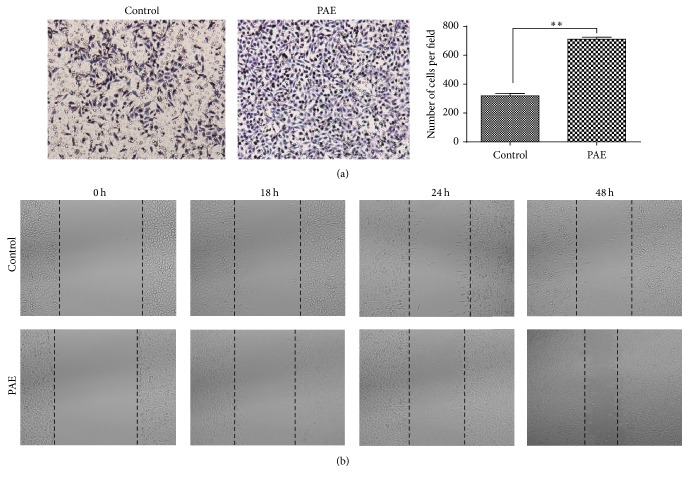
Figure 3.
Effect of PAE on cell migration in HSF cells. The differentially cultured HSF (0.3125 mg/mL) for 48 h. (a) Transwell migration assay: images obtained at 24 h after HSF were incubated in Milicells 24 h (left); the migratory cells per visual field (100x) were counted and expressed as the average numbers. Data represent mean ± SD. ∗∗p < 0.01 versus control group (right). (b) Cell scratch test: images obtained at 0, 18, 24, and 48 h after scratch formation.

