
Figure 3.
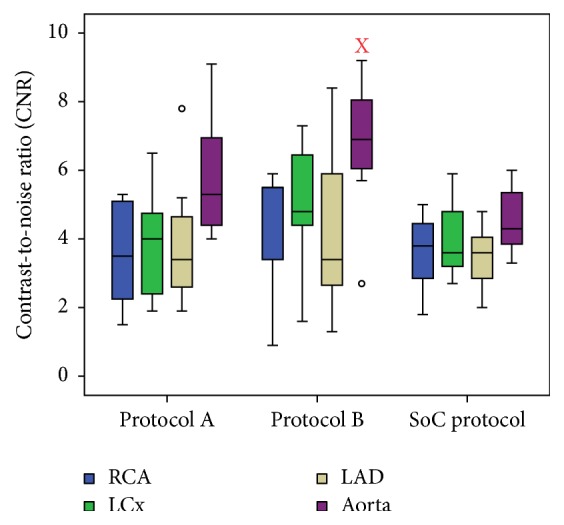
Contrast-to-noise ratio for the right coronary artery (RCA), left circumflex artery (LCx), left anterior descending artery (LAD), and aorta for both study protocols and the standard of care protocol. Boxplots display the median (middle bar), upper, and lower quartiles, while the whiskers (vertical line) indicate the variability outside the upper and lower quartiles. X indicates that there is a significant difference with the objective parameter of the standard of care protocol.