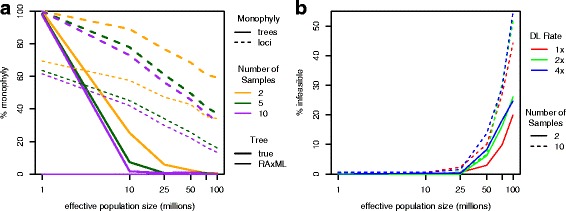
Fig. 6.

Reconciliation infeasibility in simulated flies data set. a The percentage of monophyletic trees and loci for varying number of samples using the true simulated gene tree and the reconstructed RAxML gene tree. Monophyly decreases as the population size and number of samples increase. Results are shown for duplications and losses simulated at the same rate (1 ×) as that estimated for real data; little difference is observed when the rate is varied (not shown). b The percentage of gene trees with infeasible reconciliations using RAxML gene trees. The percentage of infeasible gene trees increases as the population size, duplication-loss rate, and number of samples increase. Results for 5 samples are not shown but tend to lie between the values for 2 and 10 samples for the same population size and duplication-loss rate
