
Fig. 3.
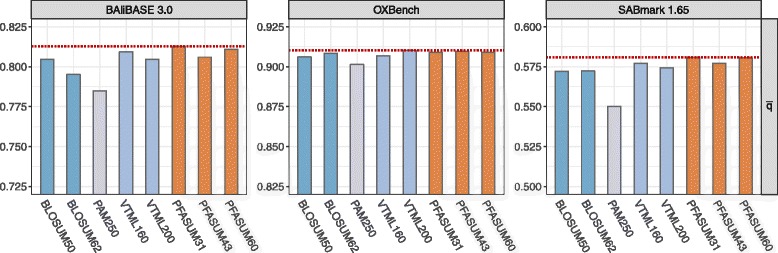
General comparison of MSA matrix performance based on the average q-score per benchmark database. PFASUM MSA Matrices outperform the tested Standard MSA Matrices on all three benchmarks. PFASUM31 achieved the highest for BAliBASE 3.0 and SABmark 1.65, while VTML200 leads all matrices on the OXBench dataset. The red dotted line indicates the maximum separately for each benchmark