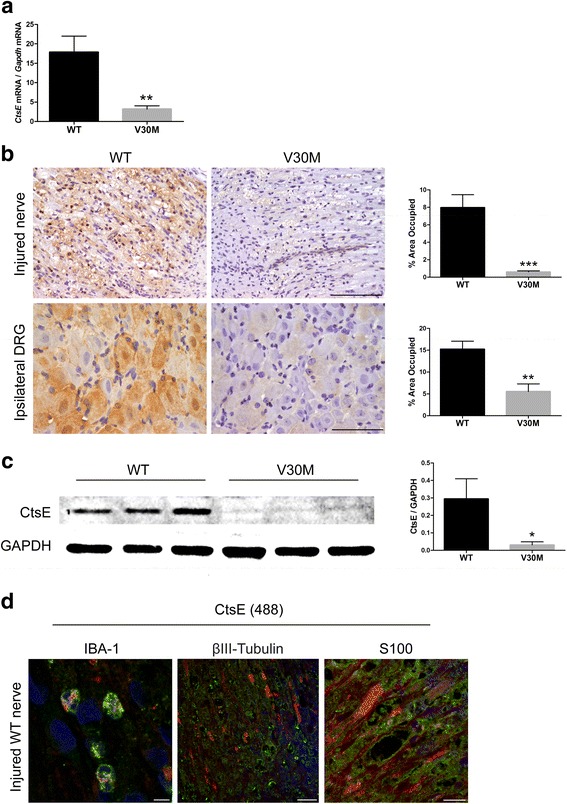
Fig. 1.

Sciatic nerve injury leads to PNS downregulation of CtsE expression in V30M mice. a Histogram represents CtsE mRNA levels in the sciatic nerve of WT and V30M mice, 7 days after injury (n = 5 for each group/**p < 0.01). b Representative SQ-IHC against mouse CtsE in WT and V30M injured nerves (upper panel) and lumbar ipsilateral DRGs (lower panel). Scale bar 50 μm. Charts represent quantification of immunohistochemical images, and data is represented as mean ± SEM (***p < 0.001 and **p < 0.01). c Representative anti-CtsE western blot from injured WT nerves versus injured nerves from V30M mice. Histogram denotes normalized CtsE/Gapdh density quantification ± SEM (*p < 0.05). d Double immunofluorescence between CtsE (green) and IBA-1, BIII-Tubulin or S100 (all in red), denoting CtsE localized mainly in macrophages and Schwann cells (yellow/orange); ×20 magnification
