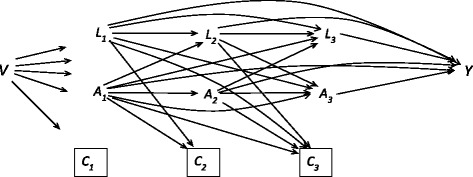
Fig. 1.

Causal graph (DAG [22]) of the study design, to illustrate the effect of exposure (A) on the outcome (Y). Symbols: baseline confounders (V), time – varying confounders including outcome (L) and censoring (C) (loss to follow-up), at baseline and follow-ups 1, 2, 3, in a Norwegian sample of 113 patients with personality disorders. An arrow symbolizes possible direct causal effect, the box around the C-symbol means “conditioned on” to reflect the fact that the analysis is restricted to those “not lost to follow-up”, a potential source of selection bias
