Fig. 3.

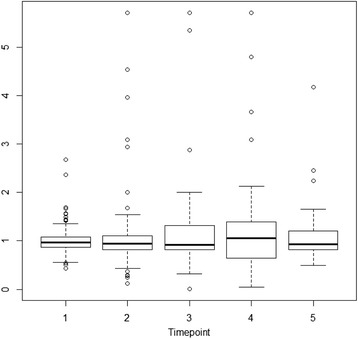
Boxplot of truncated (99th percentile) exposure weight distribution (SLFC) for each point of time 1 = baseline, …, 5 = 72 months) in a Norwegian sample of 113 patients with personality disorders

Boxplot of truncated (99th percentile) exposure weight distribution (SLFC) for each point of time 1 = baseline, …, 5 = 72 months) in a Norwegian sample of 113 patients with personality disorders