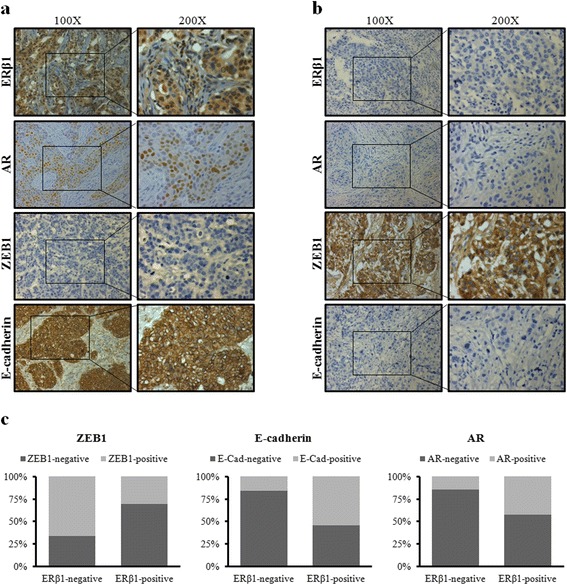
Fig. 6.

Relationships of ERβ1 with clinicopathological factors in TNBC. a, b Representative IHC staining of ERβ1 high-, AR high-, ZEB1 low-, and E-cadherin high-expression (a) or ERβ1 low-, AR low-, ZEB1 high-, and E-cadherin low-expression (b) in TNBC samples. c Expression ratio of AR, ZEB1 and E-cadherin in ERβ1-positive group or ERβ1-negative group, respectively
