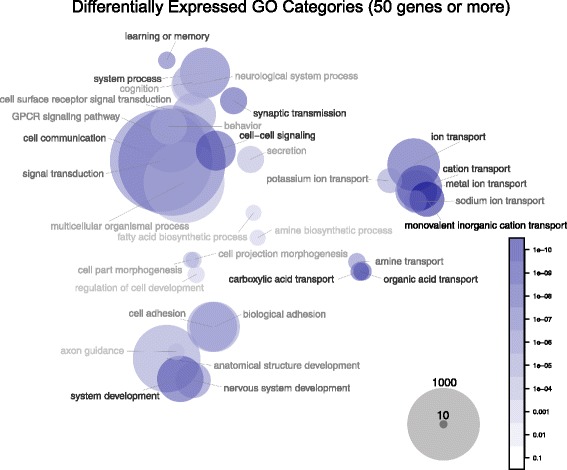
Fig. 3.

Bubble plot of GO Biological Process enrichments for gene expression differences across five tissues between human and chimpanzee. To display these traits visually, we calculated an optimal 2-dimensional arrangement using non-metric multidimensional scaling on the between-category sematic similarity scores, a measure of a priori relatedness of traits. Traits whose SimREL distance is less than 0.5 are considered similar within the GO Biological Process ontology tree (code available on request). The significantly differentially expressed categories are displayed on the same axes, but separated into two plots for clarity. In each plot, the intensity of the colors of the circles and text indicate the evidence for differential expression of each trait. The area of the circle is proportional to the log of the number of genes counted in each trait
