
Fig. 2.
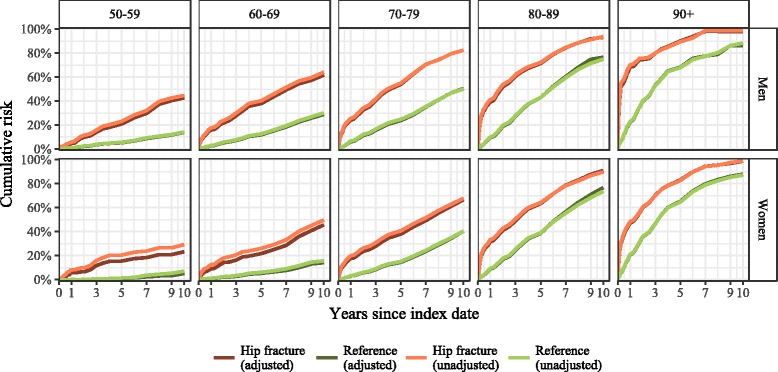
Age group-specific cumulative risk of all-cause mortality (adjusted for age and Charlson index score) by study group in men and women ≥50 years in Estonia, January 1, 2005-May 4, 2016
Official websites use .gov
A
.gov website belongs to an official
government organization in the United States.
Secure .gov websites use HTTPS
A lock (
) or https:// means you've safely
connected to the .gov website. Share sensitive
information only on official, secure websites.
Age group-specific cumulative risk of all-cause mortality (adjusted for age and Charlson index score) by study group in men and women ≥50 years in Estonia, January 1, 2005-May 4, 2016