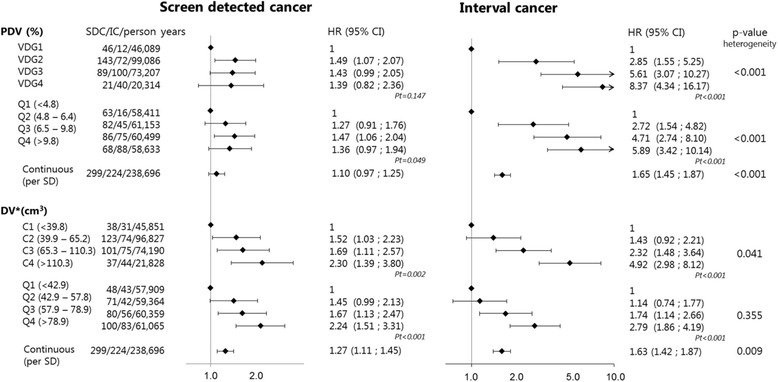
Fig. 2.

Associations between mammographic measures and risk of screen-detected breast cancer (SDC) or interval breast cancer (IC). The Lunn and McNeil method for competing risk analysis was used. Pt p trend: this was determined by adding the categorical measures as a continuous measure into the model, PDV percentage dense volume, DV dense volume, Per SD per standard deviation, VDG Volpara density grade, Q quartile, C VDG-like category. *Absolute dense volume measures were adjusted for nondense (breast fat) volume
