
Fig. 1.
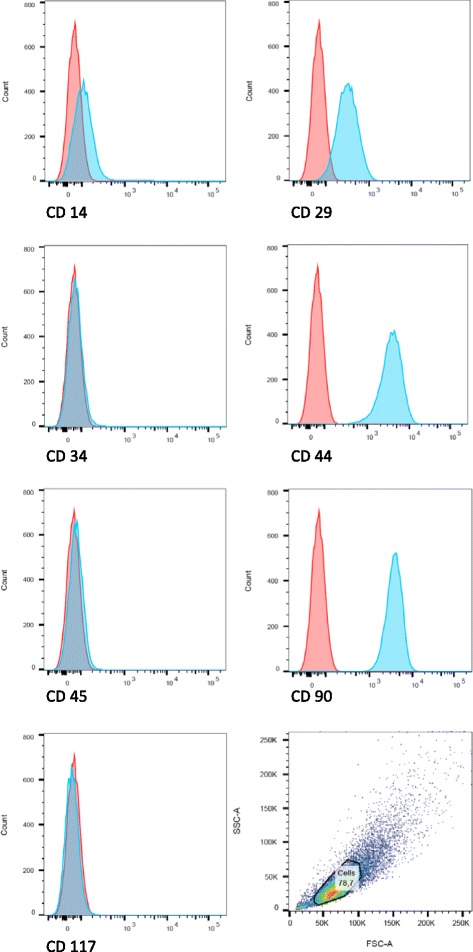
Flow cytometric analysis of cultured AT-MSCs from a representative study horse. Histograms indicate the immunophenotype of AT-MSCs for CD14, CD29, CD34, CD44, CD45, CD90 and CD117. Results are displayed for the distribution of immunostained (green) and unstained (red) AT-MSCs. All stained cells were positive for CD29, CD44 and CD90 while the signal for CD14 was weaker. No signal was detected for CD34, CD45 and CD117 (Colour figure online)