
Fig. 2.
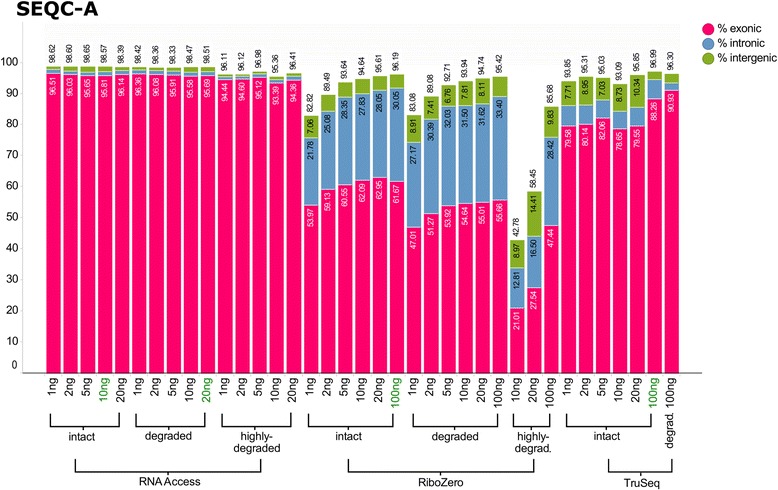
Bargraph of the alignment statistics for the SEQC-A sample and all three protocols. Each bar represents the averaged values across the three technical replicates per condition. The percentage of total aligned reads is represented by the height of the bar, and the percentage of reads aligning to exons is in red, introns in blue, and intergenic regions in green. The alignment statistics graph for the SEQC-B sample can be found in Additional file 1: Figure S4