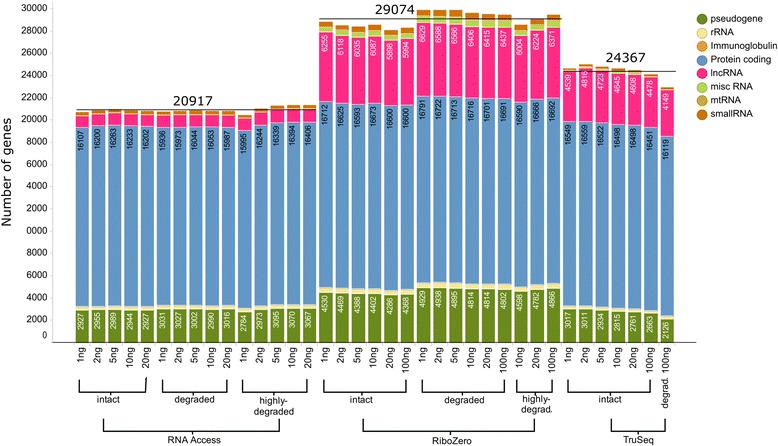
Fig. 4.

Bargraph of the number of detected genes across different protocols, degradation stages, and input amounts. The bar segments with the number of detected genes are listed by simplified Ensembl “Gene type” categories and the average number of detected genes per protocol is indicated by a black line. A gene is considered “expressed” if it has a FPKM value of at least 0.3 in one of the three technical replicates of at least one of the two samples (SEQC-A or SEQC-B)
