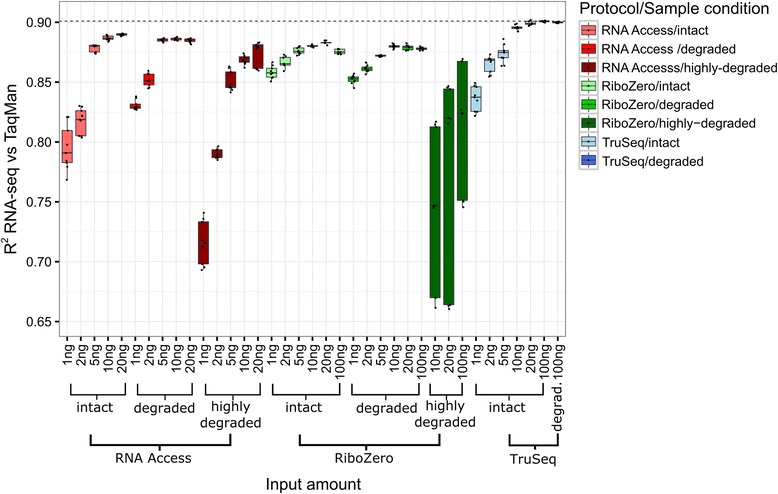
Fig. 6.

Boxplot of the coefficients of determination (R 2 values) of the RNA-seq log fold change values vs TaqMan qPCR measurements. The boxes are coloured by protocol: red for RNA Access, green for Ribo-Zero, and blue for TruSeq. Darker shades indicate boxes for samples to which a more severe degradation protocol was applied
