
Fig. 3.
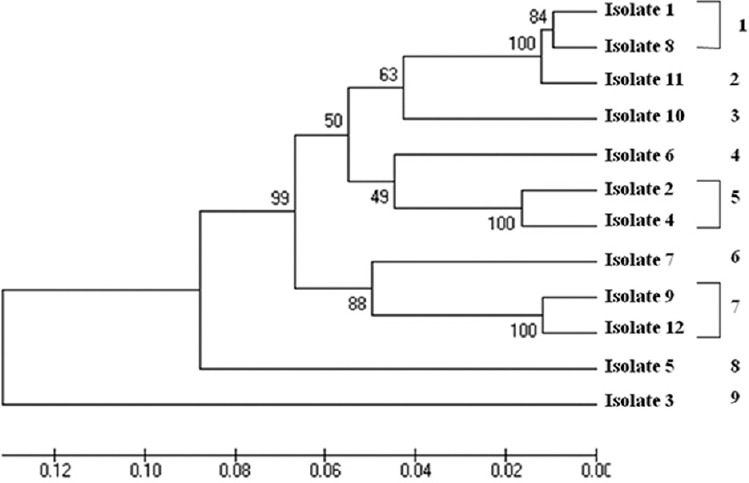
Unweighed pair group method with arithmetic mean analysis showing relationship between multilocus subtypes based on length polymorphism. The optimal tree with the sum of branch length = 0.65904592 is shown. The percentage of replicate trees, in which the associated taxa clustered together in the bootstrap test (1000 replicates) are shown next to the branches. The tree is drawn to scale, with branch lengths in the same units as those of the evolutionary distances used to infer the phylogenetic tree. The evolutionary distances were computed using the Kimura 2-parameter method and are in the units of the number of base substitutions per site. The rate variation amongst sites was modelled with a gamma distribution (shape parameter=1). The analysis involved 12 nucleotide sequences. Evolutionary analyses were conducted in MEGA5.