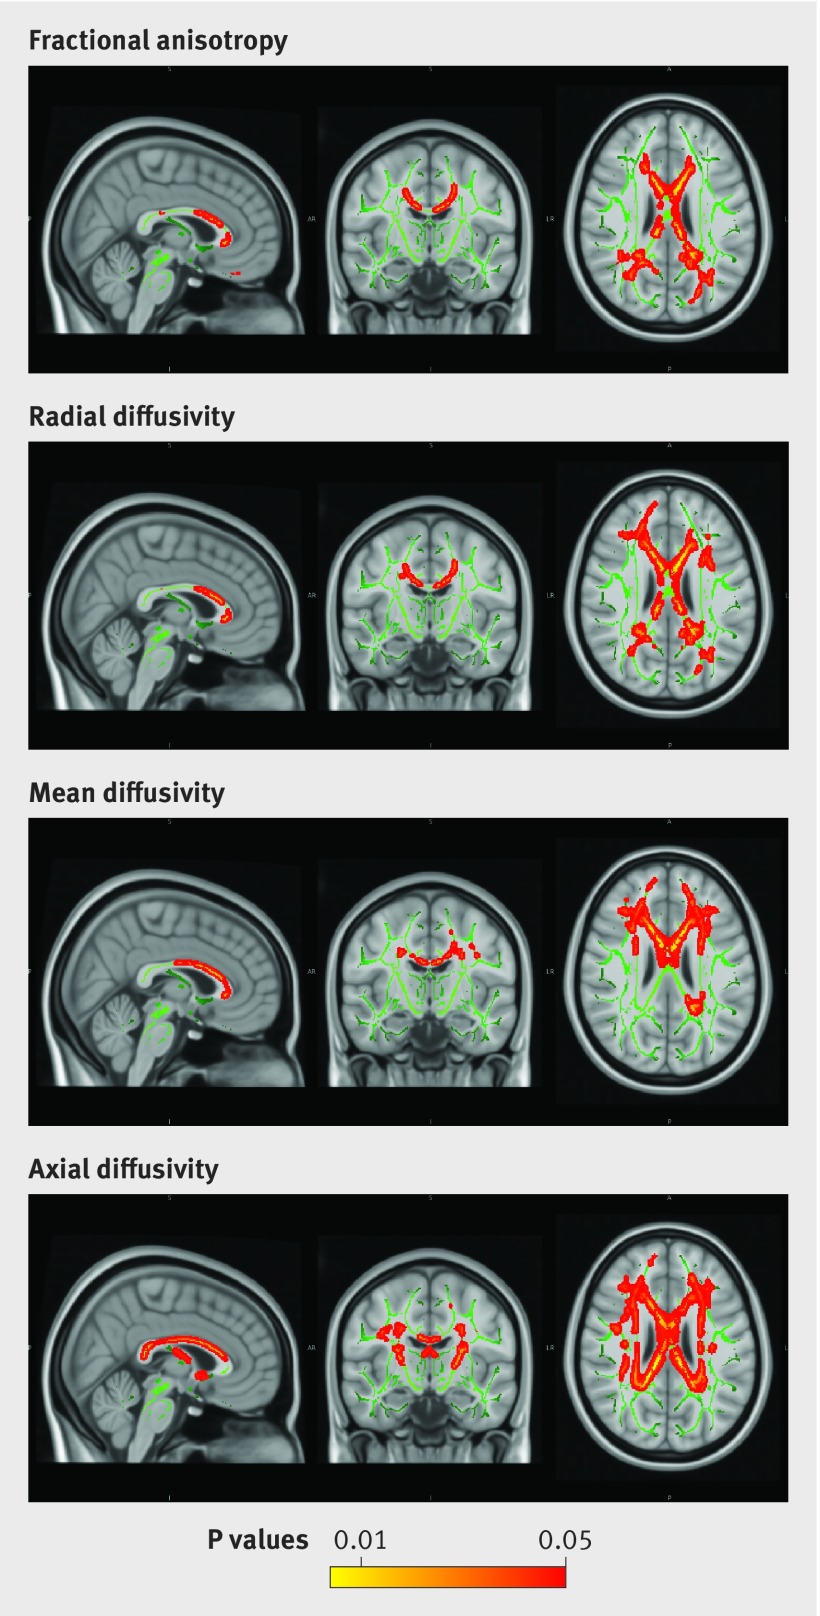
Fig 5 Tract based spatial statistics results (corrected for threshold-free cluster enhancement, TFCE) showing negative correlation between average alcohol across study (all phases) and fractional anisotropy, and positive correlations with radial diffusivity, mean diffusivity, and axial diffusivity in 511 participants. Adjusted for age, sex, education, premorbid IQ, social class, physical exercise, club attendance, social activity, Framingham stroke risk score, psychotropic drugs, and history of major depressive disorder

An official website of the United States government
Here's how you know
Official websites use .gov
A
.gov website belongs to an official
government organization in the United States.
Secure .gov websites use HTTPS
A lock (
) or https:// means you've safely
connected to the .gov website. Share sensitive
information only on official, secure websites.
