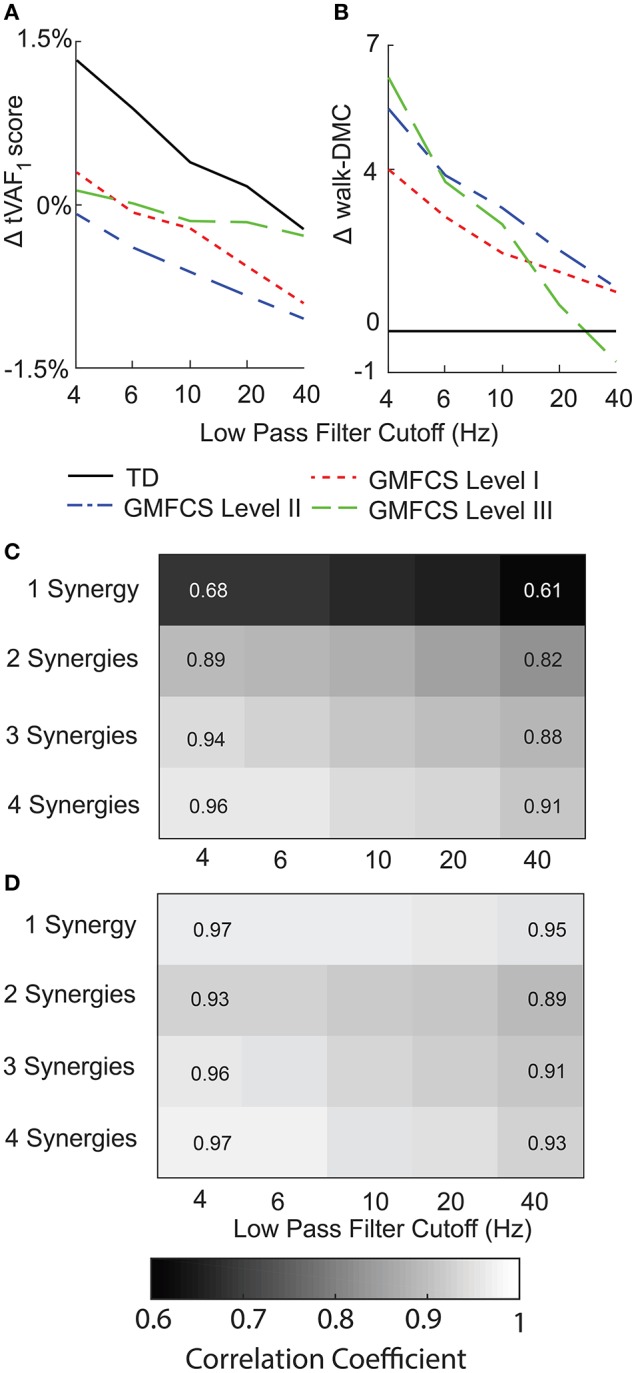
Figure 6.

Average change in (A) tVAF and (B) walk-DMC for synergies calculated with EMG data scaled by peak activation or unit variance. Positive values indicate that results from unit variance scaling were greater than peak activation scaling. Average correlation coefficients of (C) synergy weights and (D) synergy activations between EMG data scaled by peak activation or unit variance.
