. 2016 Oct 21;8(2):1525–1534. doi: 10.1039/c6sc03792e

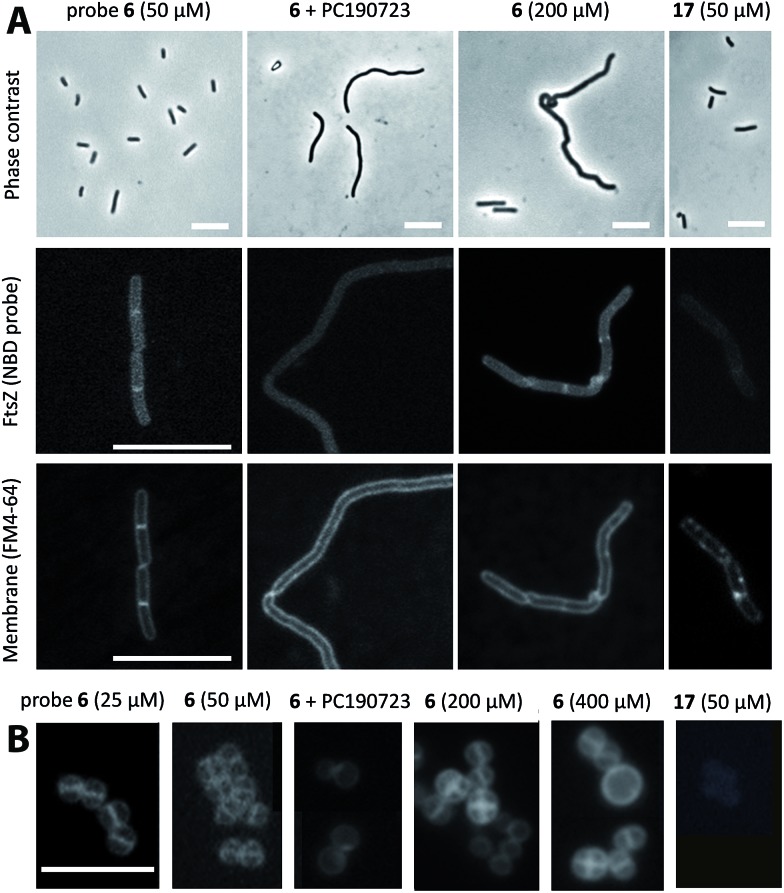
Fig. 3. Imaging FtsZ rings in bacterial cells with fluorescent benzamides. (A) B. subtilis 168 cells were treated with 50 μM 6 (1 h; untreated controls gave similar results), with 50 μM 6 plus 25 μM PC190723 (3 h), with 200 μM 6 (3 h) or with 50 μM 17 control fluorophore (1 h) and observed by phase contrast microscopy (top row). FtsZ was directly visualized with 6 (middle row) and membrane with FM4-64 (bottom row) by fluorescence microscopy. Bars, 10 μm. See Fig. S7 for growth curves and similar experiments with probes 14–16. (B) A similar experiment with S. aureus Mu50 cells treated with different concentrations of 6 and controls, observed with fluorescence microscopy. Bar, 5 μm.

Fig. 3