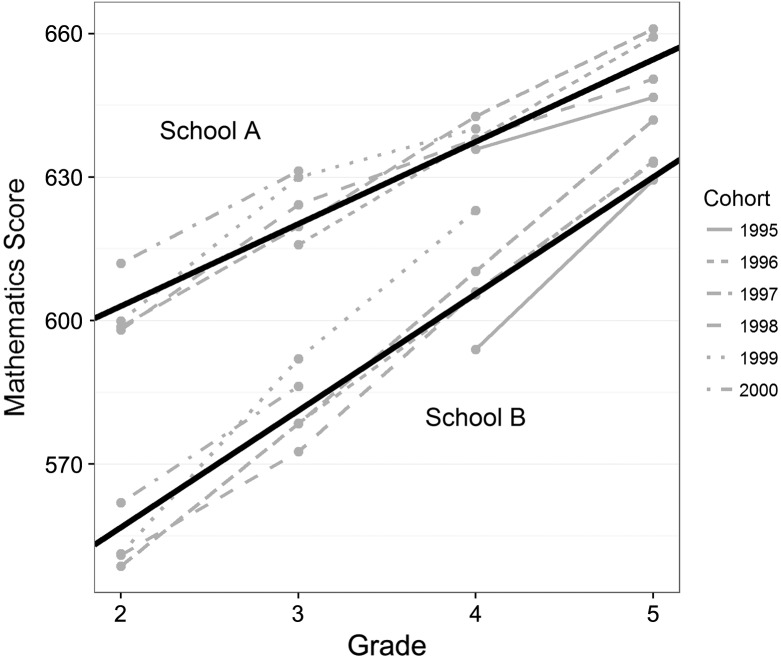
Figure 1.
Observed scores and estimated aggregate growth trajectory for two schools
Note: Points represent observed achievement scores. Gray lines connect multiple achievement scores for each cohort; cohorts are labeled by their second-grade year. Black lines represent the school average growth trajectory, estimated as detailed in the Supplementary Materials.

