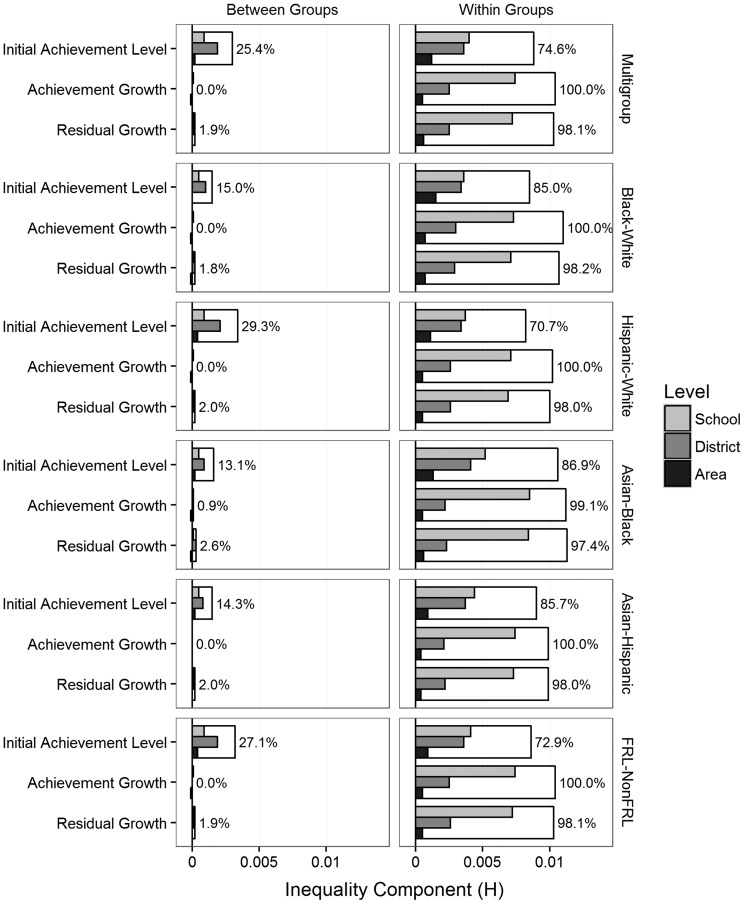
Figure 3.
Summary of decompositions of school quality within and between groups.
FRL = Eligibility for free or reduced-price lunch
Note: White bars and listed percentages reflect the total share of inequality between (left panels) and within (right panels) groups. The level inequalities (filled bars) sum to this overall value. The top panels summarize the Multigroup decompositions reported in table 3.

