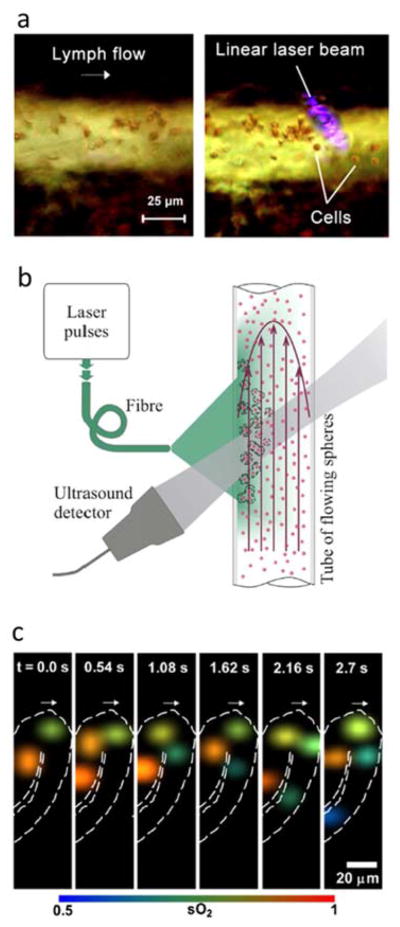
Fig 13.
Optoacoustic tracking of moving cells. (a) Cells in lymph flow of a mouse mesentery vessel before (left) and after (right) being trapped with gradient acoustic forces induced by optoacoustic waves generated by irradiation with a linear laser beam. Adapted with permission from [292]. © 2016 - Macmillan Publishers Ltd. (b) Optoacoustic set-up for measuring the flow velocity of cells via time correlation of the optoacoustic signals generated by two consecutive laser pulses. Adapted with permission from [293]. © 2016 - Macmillan Publishers Ltd. (c) Selected time-lapse images showing the oxygen saturation of individual red blood cells in cuticle capillaries obtained with high-speed optical-resolution photoacoustic microscopy (OR-PAM). Adapted with permission from [41]. © 2013 Society of Photo Optical Instrumentation Engineers.

