Fig 16.
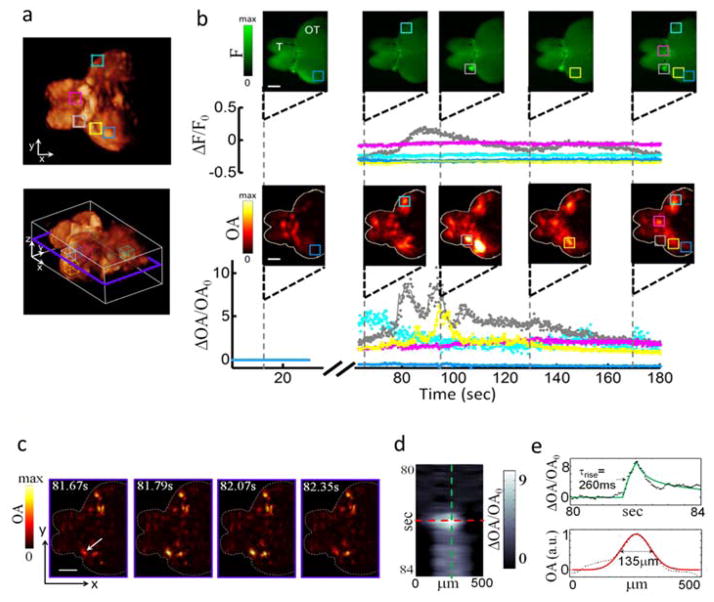
Functional optoacoustic neurotomography (FONT) visualizes neuronal activity using the genetically-encoded calcium indicator GCaMP5G [255]. (a) Volumetric optoacoustic images of an adult zebrafish brain. (b) Real-time imaging of calcium activity with epi-fluorescence (top) and optoacoustics (bottom) after injection of the neurostimulant agent pentylenetetrazole (PTZ) into the brain. Temporal traces in the 5 marked regions of interest are shown. The fluorescence images have very blurry appearance indicating that the intense light scattering in large brains makes them inaccessible by optical microscopy methods. In contrast, FONT is able to provide high-resolution three-dimensional information regarding real-time neuronal activity in the entire scattering brain. (c) Time-resolved images from a single slice through the 3D data, as indicated in violet in (a). (d) Close-up spatio-temporal resolution analysis of a single line, whose orientation is indicated by an arrow in (c). (e) Temporal and spatial profiles through the image in (d). Scale bars − 500 μm. Adapted with permission from [255]. © 2016 - Macmillan Publishers Ltd.

