
Figure 3.
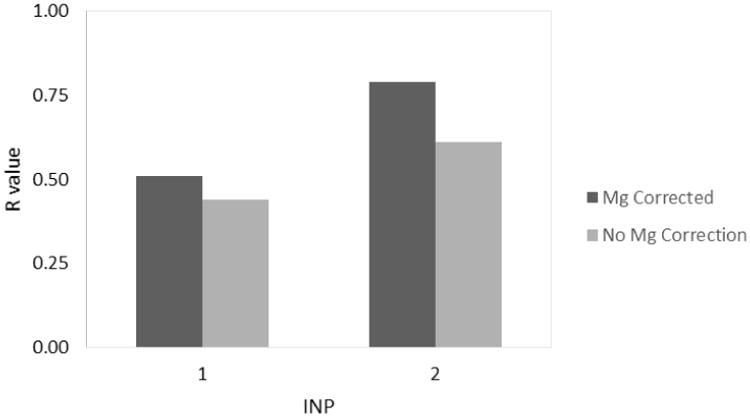
Parameter optimization for the non-polar solvation model, inp (epsin=20, epsmem=4). The R value indicates the correlation for the data set at the given inp value.
Official websites use .gov
A
.gov website belongs to an official
government organization in the United States.
Secure .gov websites use HTTPS
A lock (
) or https:// means you've safely
connected to the .gov website. Share sensitive
information only on official, secure websites.
Parameter optimization for the non-polar solvation model, inp (epsin=20, epsmem=4). The R value indicates the correlation for the data set at the given inp value.