
Figure 7.
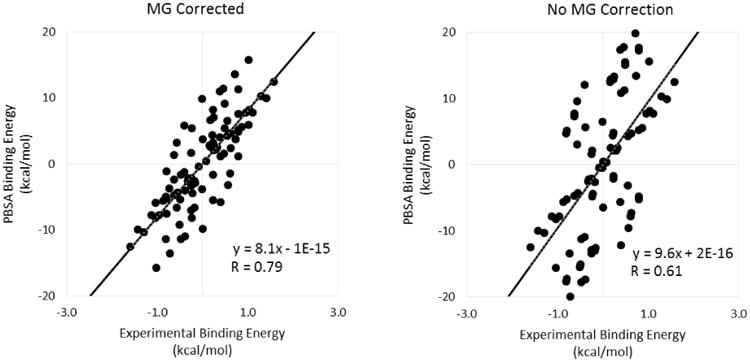
Relative binding free energy (ΔΔG) correlation plots (inp=2, epsin=20, and epsmem=4). The plot that was corrected for the removal of the magnesium ion appears on the left while the plot that did not take into account the magnesium correction appears on the right.