
Figure 8.
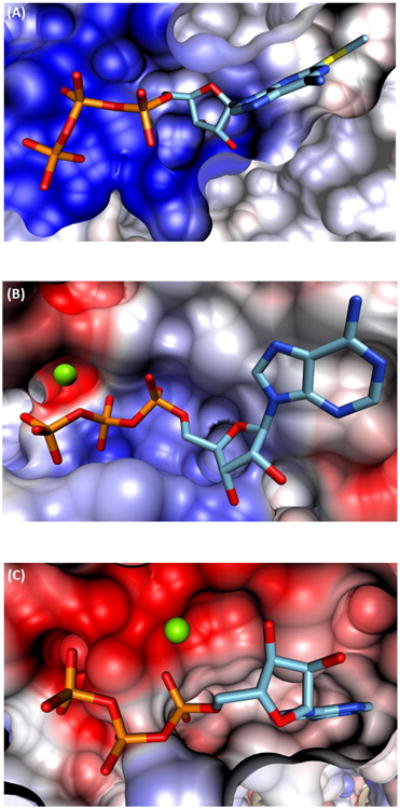
Cross-sectional comparison of the ATP binding site for A) P2Y12R, B) GRK1, and C) FlaH. Blue and red coloring reflects a net positive or negative charge, carbon bonds are shown in cyan, phosphorus bonds are depicted in orange, and the magnesium ions are shown in green.