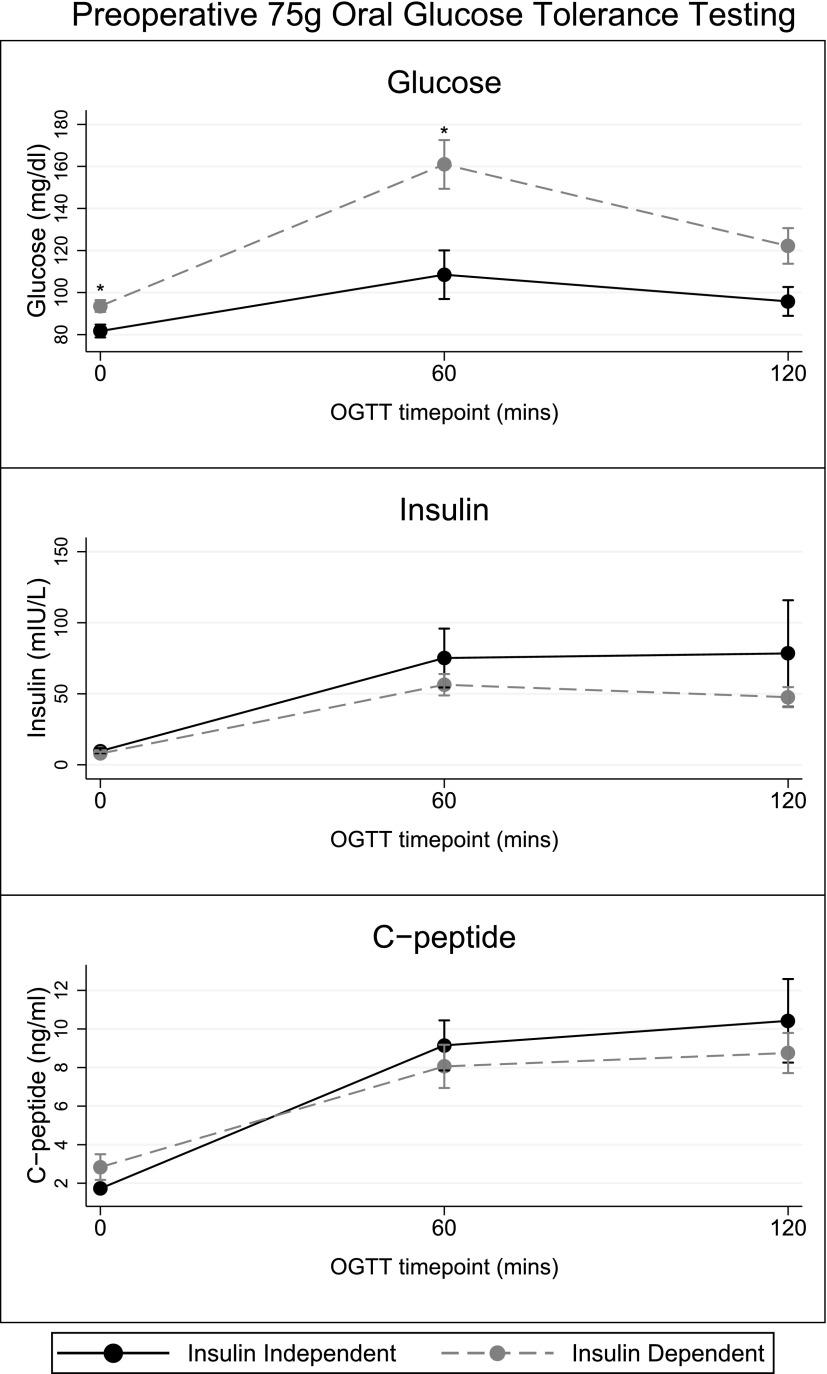
Figure 1.
Glucose, insulin, and C-peptide levels (mean ± standard error) during a 75-g OGTT comparing those that are insulin-independent vs insulin-dependent at 1-year follow-up. For the insulin-independent vs insulin-dependent groups, levels for the fasting, 60-minute, and 120-minute glucose values were 82 ± 3 mg/dL vs 94 ± 3 mg/dL (P = 0.02), 109 ± 12 mg/dL vs 161 ± 12 mg/dL (P = 0.01), and 96 ± 7 vs 122 ± 9 mg/dL (P = 0.06). Similarly, levels for the fasting, 60-minute, and 120-minute insulin values were 10 ± 2 mIU/L vs 8 ± 1 mIU/L (P = 0.51), 75 ± 21 mIU/L vs 56 ± 8 mIU/L (P = 0.30), and 78 ± 38 mIU/L vs 48 ± 7 mIU/L (P = 0.19). Lastly, levels for the fasting, 60-minute, and 120-minute C-peptide values were 1.7 ± 0.2 ng/ml vs 2.8 ± 0.7 ng/ml (P = 0.31), 9.1 ± 1.3 ng/ml vs 8.1 ± 1.1 ng/ml (P = 0.61), and 10 ± 2.2 ng/ml vs 8.8 ± 1.0ng/ml (P = 0.46).

