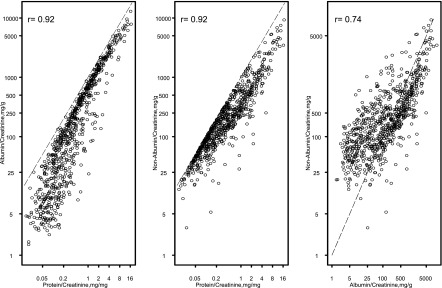
Figure 1.
Collinearity between the three methods to quantify proteinuria at the index study visit, n=751. The dashed line shown in each of the panels in Figure 1 is the line on which all of the data would fall if there were perfect agreement between the two variables.

