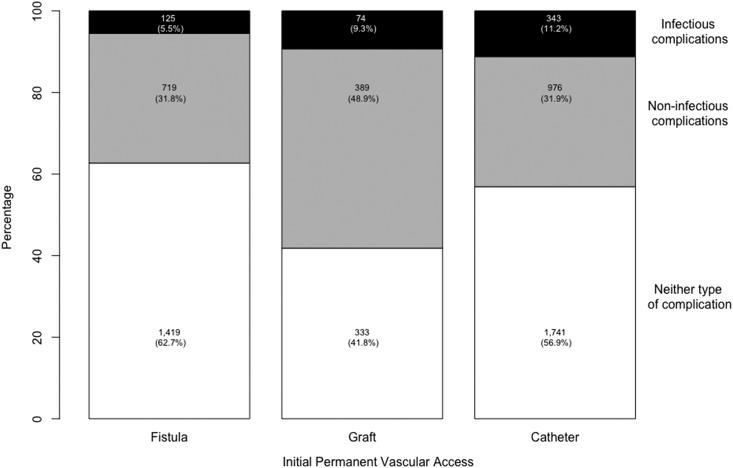
Figure 3.
Distribution of access complications by initial permanent access type. Access complications include noninfectious complications only (n=2084) and any infectious complications (n=542). In this plot, people who experienced both complications (n=325) were included in the infectious complication group only.

