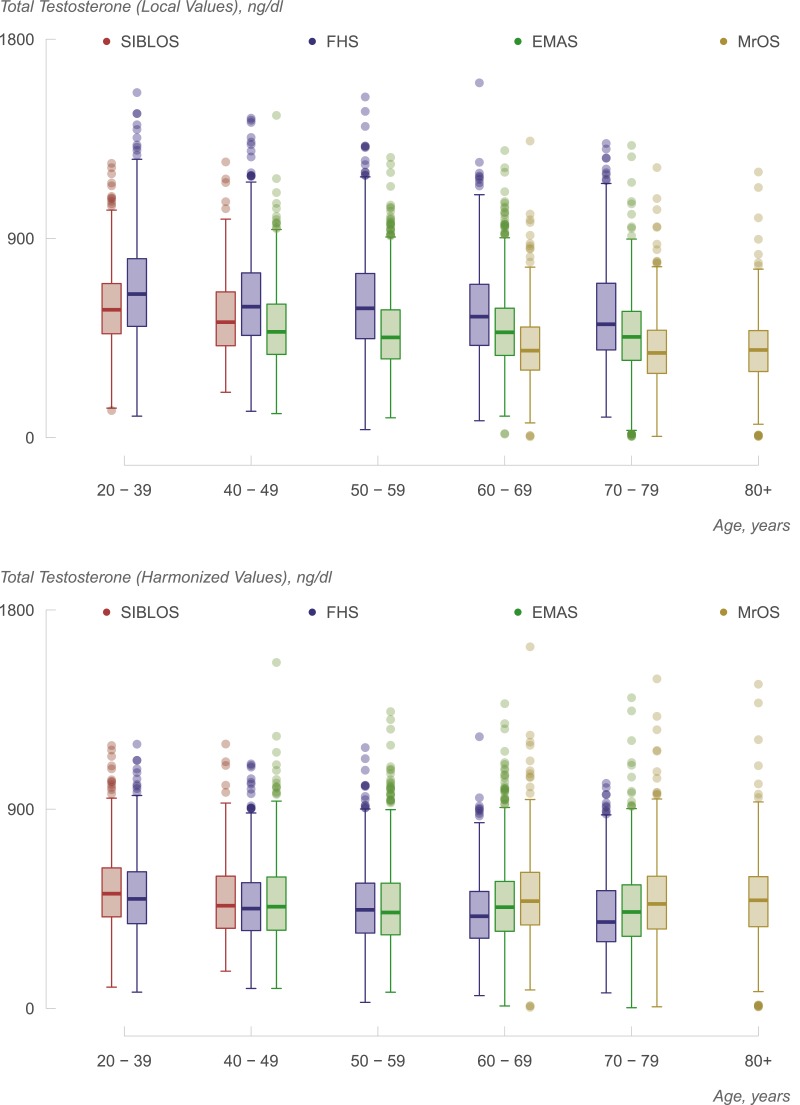
Figure 2.
Box and whisker plots showing the distribution of total testosterone levels by decades of age in the four cohorts without harmonization (upper panel) and after harmonization (lower panel). The lower and upper boundaries of the box represent the 25th and 75th percentile values; the line inside the box represents the median. Independent adjustment of each study’s measurements to the CDC (as shown in the lower panel) reduces interstudy variation substantially over that observed in unstandardized measurements (shown in the upper panel).

