
Extended Data Figure 1. Quantification of mouse OKR.
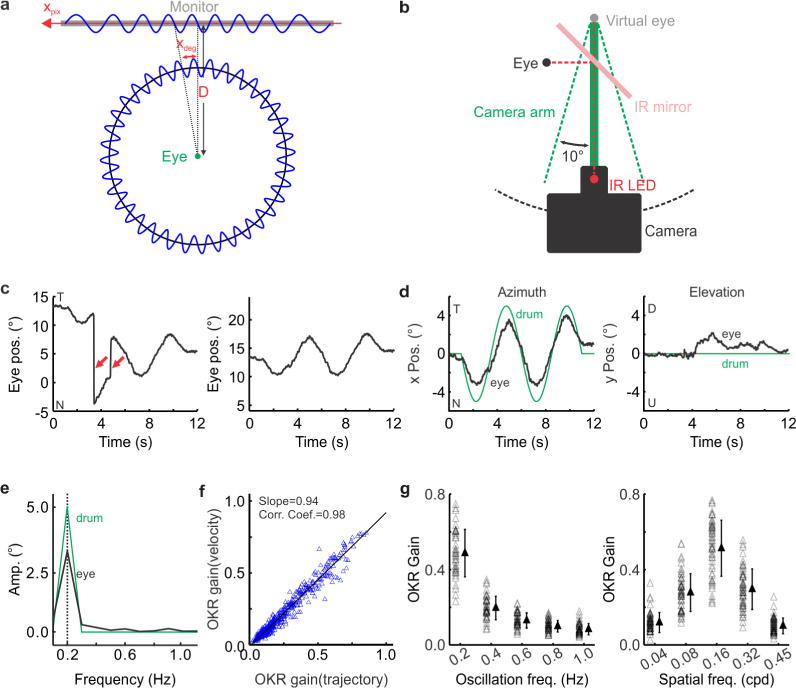
a, Transformation of sinusoidal gratings from cylindrical coordinates of the virtual drum to Cartesian coordinates of the monitor. xpix is the horizontal pixel position in Cartesian coordinates. D is the distance from the centre of monitors to the eye. xdeg is the azimuth angle of pixels in cylindrical coordinates. Note that the spatial period of the grating on the monitor is not uniform. See Methods for details. b, Schematic of calibration of the measurement of eye position. The camera is moved along a circumference centred on the image of the eye by ± 10°. c–e, Example traces of OKR eye trajectory and corresponding fast Fourier transform (FFT) spectra. c, Left, raw trace of one individual eye trajectory with both slow OKR component and fast saccade-like component (red arrows; T, temporal; N, nasal). Right, isolated OKR component after removal of the saccade-like component. Spatial frequency, 0.08 cpd; oscillation frequency, 0.2 Hz. d, Eye trajectories in horizontal azimuth (left) and vertical elevation (right) overlaid with corresponding drum trajectories (the same example as in c). Note that OKR eye movement is mainly restricted to the axis of the drum movement. D, down; U, up. e, Fourier transform spectra of eye trajectory and drum trajectory in d (left). The amplitude of the OKR trajectory peaks at the principal frequency (dotted line). f, OKR gain derived from OKR velocity versus OKR eye trajectory. Each point is one trial. Solid line, linear regression. g, Population summary of OKR gain evoked by five oscillation frequencies (left, spatial frequency 0.08 cpd) and five spatial frequencies (right, oscillation frequency 0.4 Hz). Each point is one mouse (n = 39 for oscillation frequency and 49 for spatial frequency). Data shown as mean ± s.d.