
Figure 1. Visual cortex contributes to OKR potentiation.
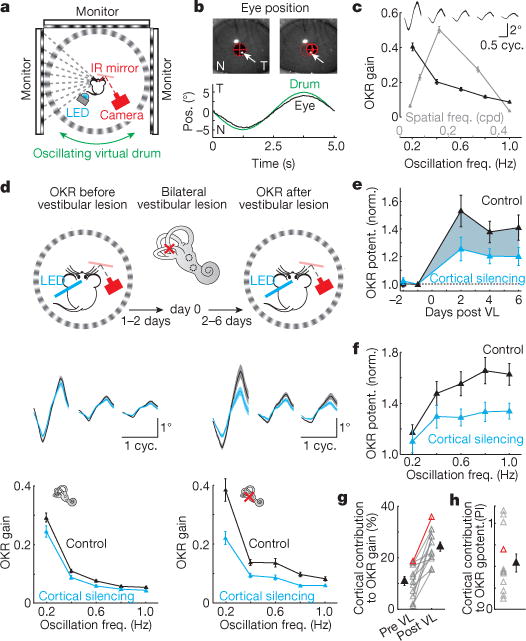
a, Schematic of experimental setup. b, Top, snapshots of nasal (N; left) and temporal (T; right) eye positions. Red ellipses, pupil fit. Red crosses, pupil centres. Arrows, corneal reflection of reference LED. Bottom, cycle average of individual eye trajectory overlaid with drum trajectory. c, Data from example mouse. Oscillation frequency and spatial frequency tuning curves (n = 32 and 48 trials, respectively). Top traces, cycle-averaged OKR trajectories (n = 96–720 cycles). Thickness, s.e.m. d, Data from example mouse. Top, schematic of experimental design. Bottom, oscillation frequency tuning curves of OKR gain before vestibular lesion (VL; left, n = 60 trials) and 2 days after vestibular lesion (right, n = 30 trials). Blue and black curves, with and without cortical silencing. Top traces, cycle-averaged OKR trajectories (n = 120–600 cycles). Thickness, s.e.m. e, Population average of OKR potentiation following vestibular lesion. Black, no cortical silencing. Blue, cortical silencing (n = 13 mice). Shaded area illustrates cortical contribution to OKR potentiation. f, Population tuning curves of OKR potentiation following vestibular lesion (n = 13 mice). g, Population summary of cortical contribution to OKR gain before (Pre VL) and after vestibular lesion (Post VL). h, Population summary of cortical contribution to OKR potentiation (potentiation index, PI). Red data point in g and h: animal in d. n = 12 mice for g and h. Data in c–h shown as mean ± s.e.m.