
Figure 4. Enhanced cortical modulation of NOT-DTN activity with OKR potentiation.
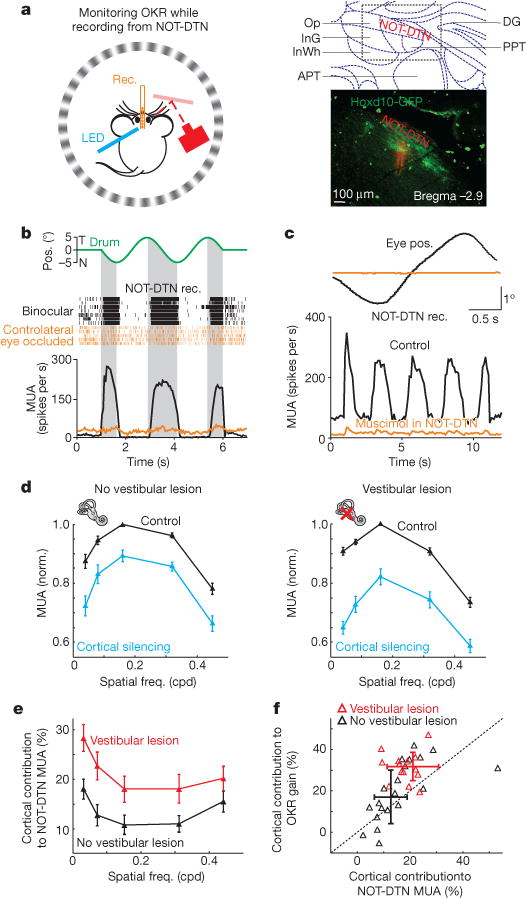
a, Left, schematic of experimental setup. Right, top, NOT-DTN and surrounding nuclei (modified from Paxinos, G. & Franklin, K. The Mouse Brain in Stereotaxic Coordinates (Elsevier, 2007)); bottom, coronal slice of NOT-DTN from Hoxd10-GFP mouse. Green, GFP; red, electrode track labelled with DiI. b, Data from example mouse. Top, drum trajectory. Shaded areas, temporo-nasal phase of drum trajectory. Bottom, raster plot and post-stimulus time histogram (PSTH) of NOT-DTN multiunit activity (n = 30 and 18 trials for binocular (black) and ipsilateral vision (orange), respectively). c, Data from example mouse. Cycle averages of all eye trajectories (top) and simultaneously recorded NOT-DTN activity (bottom) before (black; n = 49 trials) and after silencing NOT-DTN with muscimol (orange; n = 49 trials). d, Population tuning curves of NOT-DTN activity for naive mice (no vestibular lesion, n = 17 mice) and mice with vestibular lesion (n = 17 mice). Curves normalized to best frequency in control. Data shown as mean ± s.e.m. e, Population tuning curves of cortical contribution to NOT-DTN activity (n = 17 mice for both groups). Data shown as mean ± s.e.m. f, Correlation between cortical contribution to OKR gain and cortical contribution to NOT-DTN activity in naive animals (black, no vestibular lesion) and lesioned animals (red; correlation coefficient, 0.55). Data shown as mean ± s.d.; dotted line, unity line.