
Figure 5. Impact of cortex on NOT-DTN activity matches cortical contribution to OKR potentiation.
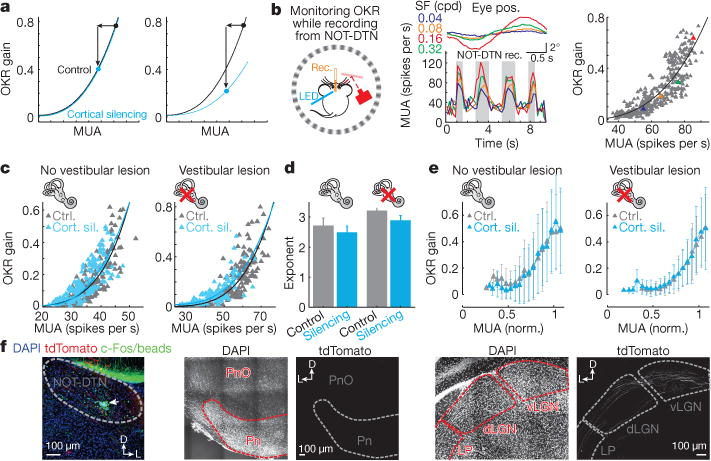
a, Model transfer functions. Left, reduction in NOT-DTN activity (leftward arrow) upon cortical silencing leads to a reduction in OKR gain (downward arrow) predicted by the transfer function obtained under control conditions. Right, reduction in OKR gain upon cortical silencing is larger than predicted by the transfer function. b, Data from example mouse. Left, schematic of experimental setup. Middle, cycle averages of OKR trajectory (top, n = 3 cycles) and PSTH of simultaneously recorded NOT-DTN activity (bottom) in individual trials of four different spatial frequencies (colour coded). Right, transfer function. Each data point is one trial. Coloured triangles, trials illustrated in the middle. MUA, firing rate during the temporo-nasal phase (shaded in PSTH). Solid curve, best fit of power function. c, Data from example mice. Transfer functions of a naive mouse (no vestibular lesion) and a mouse with vestibular lesion. d, Population averages of exponent of transfer functions for naive (non-lesioned, n = 17) and lesioned mice (n = 17). e, Population-averaged normalized transfer functions for naive (non-lesioned) and lesioned mice. Data shown as mean ± s.d. f, Left, confocal image of NOT-DTN. White arrow, injection site of CAV2-Cre virus. Middle and right, confocal images of pontine nuclei (Pn) and visual thalamus (LP, dLGN and vLGN). D, dorsal; L, lateral.