
Extended Data Figure 2. Optogentic silencing of visual cortex.
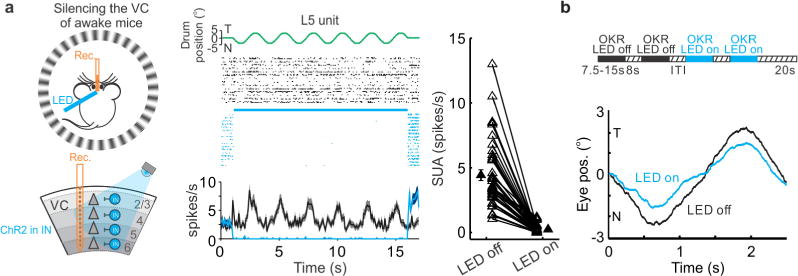
a, Left, schematic of experimental setup. IN, inhibitory neurons; VC, visual cortex. Middle, raster plot and PSTH of a single unit. Black, control condition; blue, cortical silencing. Blue bar, duration of blue light illumination (15 s). Control and photostimulation trials were interleaved (see b), but are separated here for clarity. Right, summary of firing rate of regular spiking units (n = 40). Data shown as mean ± s.e.m. b, Top, block design to examine the impact of cortical silencing on OKR performance. LED off, control trials; LED on, cortical silencing trials. Bottom, cycle averages of one individual OKR eye trajectory. T, temporal; N, nasal.