
Extended Data Figure 3. Visual cortex contributes to OKR potentiation across spatial frequencies.
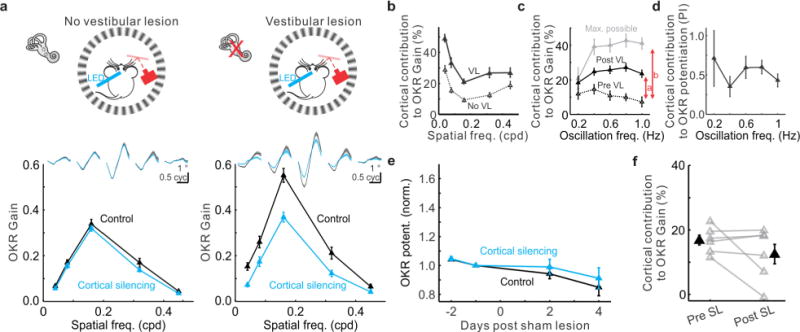
a, Data from example mice. OKR performance of a naive animal (no vestibular lesion, left) and an animal with vestibular lesion (right). Top, schematic experimental setup. Bottom, cycle averages of all eye trajectories evoked by five spatial frequencies (oscillation frequency 0.4 Hz), and the corresponding OKR gains. Thickness of traces shows s.e.m. Data shown as mean ± s.e.m. b, Population average of cortical contribution to OKR gain at five spatial frequencies for animals with vestibular lesion (VL, solid line, n = 17 mice) and naive animals (no VL, dotted line, n = 51 mice). Data shown as mean ± s.e.m. c, Population average of cortical contribution to OKR gain at five oscillation frequencies before vestibular lesion (Pre VL, dotted line) and after vestibular lesion (Post VL, solid black line). The grey line is the maximal possible cortical contribution to OKR gain after vestibular lesion assuming the entire OKR potentiation depends on visual cortex (Max. possible) (n = 13 animals). Data shown as mean ± s.e.m. d, Population average of cortical contribution to OKR potentiation (potentiation index, PI) measured as the ratio between a and b (illustrated in c) at each oscillation frequency. Data shown as mean ± s.e.m. e, Population averages of pseudo-OKR potentiation following sham lesions. Black data points: no cortical silencing, normalized by OKR gain before sham lesions without cortical silencing. Blue data points: cortical silencing, normalized by OKR gain before sham lesions during cortical silencing (n = 6 mice). Data shown as mean ± s.e.m. f, Population summary of cortical contribution to OKR gain before (Pre SL) and after sham lesions (Post SL). Data shown as mean ± s.e.m.