
Extended Data Figure 5. Identification of the NOT-DTN based on retinal input and c-Fos expression.
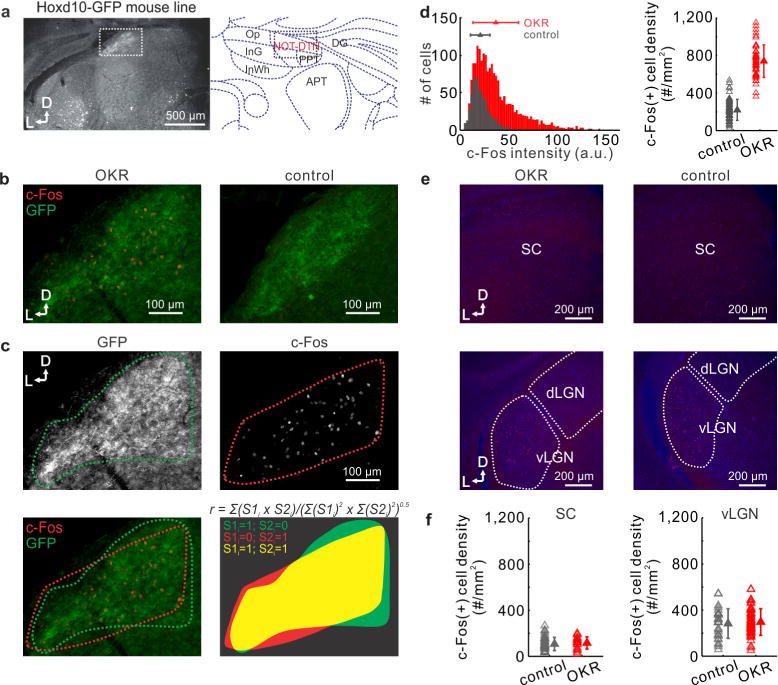
a, Left, coronal section of NOT-DTN of Hoxd10-GFP mouse. The distribution of GFP-expressing RGC axons delineates the NOT-DTN (dotted box). Right, delineation of NOT-DTN and surrounding nuclei (modified from Paxinos, G. & Franklin, K. The Mouse Brain in Stereotaxic Coordinates (Elsevier, 2007)) for the corresponding coronal plane. D, dorsal; L, lateral. b, c-Fos immunostaining of coronal slices containing NOT-DTN of Hoxd10-GFP mice. Left, section from an animal that underwent OKR stimulation. Note that the distribution of GFP RGC axons overlaps with that of c-Fos-positive cells. Right, section from an animal that did not undergo OKR stimulation (control). c, Quantification of the extent of overlap between GFP RGC axons and c-Fos-positive cells in b (left). Top left, boundary of the domain of RGC axons. Top right, boundary of the domain of c-Fos-positive cells. Bottom left, overlay of those two boundaries. Bottom right, calculation of overlap coefficient r of those two domains (see Methods). d, Left, histogram of fluorescence intensity of c-Fos-positive cells. Data shown as mean ± s.d. P < 10−20. Right, summary of density of c-Fos-positive cells in NOT-DTN. Each data point represents one slice. Data shown as mean ± s.d. P < 10−20. n = 50 slices from 4 mice of OKR group and 59 slices from 4 mice of control group. e, c-Fos immunostaining of coronal slices containing superior colliculus (SC, top) or vLGN (bottom). Blue, DAPI; red, c-Fos. f, Summary of density of c-Fos-positive cells in superior colliculus (left) and vLGN (right). Each data point represents one slice. Data shown as mean ± s.d. n = 4 mice for both OKR group and control group.