
Extended Data Figure 8. Tuning properties of NOT-DTN neurons.
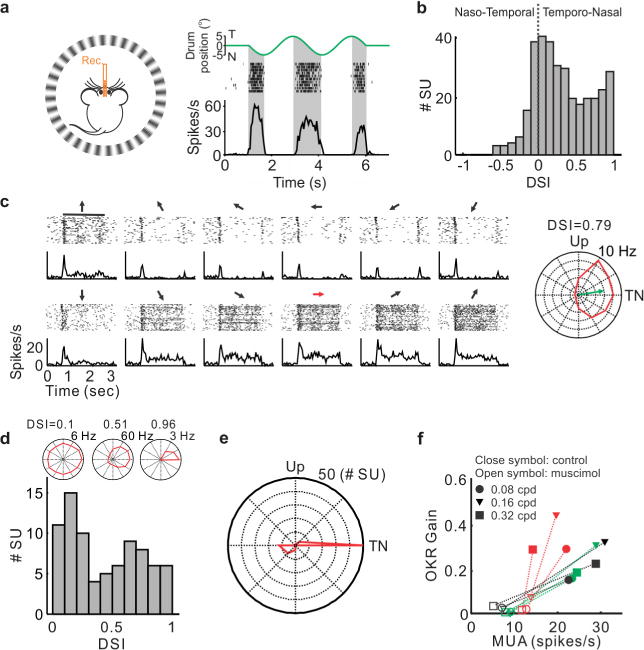
a, Left, schematic of experimental setup; mouse under anaesthesia. Right, raster plot and PSTH of an example single unit. Shades indicate the temporonasal phase of drum trajectory. b, Histogram of direction selectivity index (DSI) of single units in NOT-DTN stimulated by oscillatory drum movement. c, Example single unit. Left, raster plot and PSTH of responses evoked by moving gratings of 12 equally spaced directions (indicated by arrows, red arrow for temporonasal direction). Bar, duration of stimulation. Right, polar plot of the same unit. Green arrow, preferred direction. d, Top, example polar plots of weak DSI, medium DSI and strong DSI units. Bottom, histogram of DSI of NOT-DTN units stimulated by grating movement of 12 directions. e, Summary of preferred direction for NOT-DTN units with DSI greater than 0.1. Note the dominant preference for temporonasal direction. f, OKR gain and NOT-DTN multi-unit activity recorded before (closed) and after (open) silencing NOT-DTN with muscimol. Each colour represents one animal. Note that strong suppression of NOT-DTN activity leads to the abolishment of the OKR. Mice were awake during recording.