
Extended Data Figure 9. Cortical silencing induces a larger shift along the transfer function after vestibular lesion.
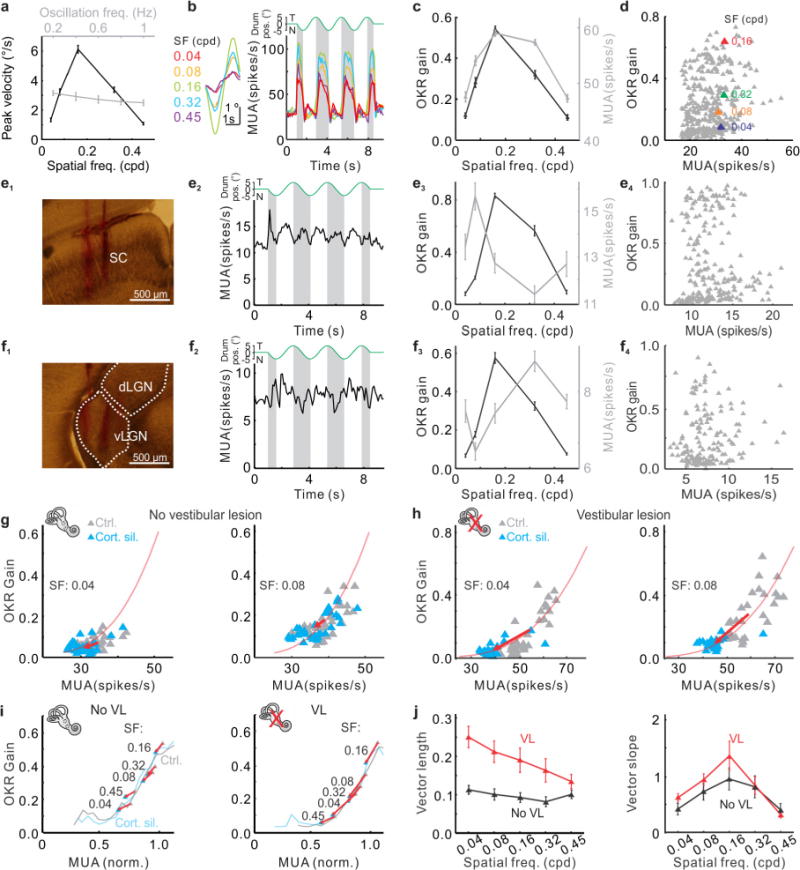
a, Example spatial frequency tuning and oscillation frequency tuning curves of OKR peak velocity. Note that while the OKR peak velocity is modulated by the spatial frequency of the drum stimulus (black), it is constant across oscillation frequencies (grey). Data shown as mean ± s.e.m. b, Data from example mouse. Left, cycle averages of all eye trajectories triggered by five different spatial frequencies. Right, the corresponding PSTH of NOT-DTN multi-unit activity. Note the correlation between the amplitude of eye trajectory and the amplitude of activity. Shades indicate the temporonasal phase of drum trajectory. c, Spatial frequency tuning curves of OKR gain (black) and NOT-DTN activity (grey) from b. Data shown as mean ± s.e.m. d, Pseudotransfer function from the animal shown in Fig. 5b using the firing rate during the nasotemporal instead of the temporonasal phase. Each data point represents one trial. Coloured triangles represent the same trials as illustrated in Fig. 5b (middle). Note the lack of correlation between OKR gain and the nasotemporal phase of multi-unit activity (MUA) recorded in NOT-DTN. e, Example spiking activity in superior colliculus (SC) during OKR stimulation. e1, Image of coronal slice containing superior colliculus. Red, electrode track labelled with DiI. e2, PSTH of superior colliculus MUA. e3, Spatial frequency tuning curves of OKR gain (black) and superior colliculus activity (grey). Data shown as mean ± s.e.m. e4, Pseudo-transfer function using superior colliculus activity. Note the lack of correlation between OKR gain and MUA recorded in superior colliculus. f, As in e, except for spiking activity in ventral lateral geniculate nucleus (vLGN) during OKR stimulation. Note the lack of correlation between OKR gain and MUA recorded in vLGN. Data shown as mean ± s.e.m. g, Data from example mouse. Recording from NOT-DTN. Shift along the transfer function upon cortical silencing for data points obtained at two different spatial frequencies (SF; left, 0.04 cpd; right, 0.08 cpd) in a naive animal (no vestibular lesion). The vector (arrow) connects the centres of mass of control (grey) and cortical silencing trials (blue) obtained at the same spatial frequency. Red line, transfer function computed with data obtained at all tested spatial frequencies under control conditions (that is, without cortical silencing). h, As in g, except for an animal with vestibular lesion. Note longer vectors as compared to g. i, Population summary of vectors for five different spatial frequencies computed on averaged normalized transfer functions in naive animals (no VL; left; n = 17) and animals with vestibular lesion (VL; right; n = 17). j, Population averages of vector lengths (left) and slopes (right) for naive animals (no VL; black; n = 17) and animals with vestibular lesion (VL; red; n = 17). Data shown as mean ± s.e.m.