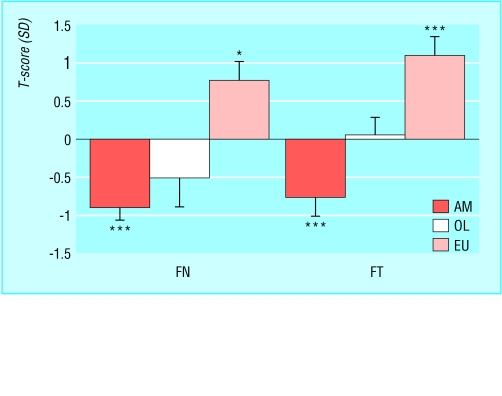
Figure 4.
Bone mineral density of proximal femur of 50 endurance trained female runners compared with the young peak bone mass according to a standard reference range (Hologic Inc). This is known as the T score and is expressed in standard deviations above or below the mean. This chart shows the approximate linear relation between number of menstrual cycles per year and bone density. (AM=amenorrhoeic (0-3 cycles a year), OL=oligomenorrhoeic (4-10 cycles a year), EU=eumenorrhoeic (11-13 cycles a year), FN=neck of femur, FT=trochanteric region of proximal femur. *P<0.02, **P<0.01, ***P<0.001.

