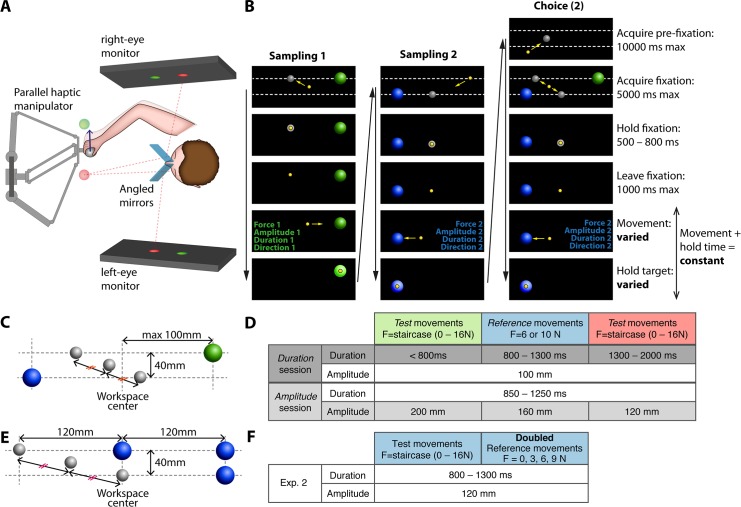
Fig 1. Task design for assessing the effort of reaching.
A. Haptic 3D augmented reality setup. Subjects moved a haptic manipulator handle with adjustable resistive force when reaching. Visual stimuli, here pictured as transparent spheres, were stereoscopic virtual images superimposed to the manipulator workspace, seen by the subject through the mirror-based virtual reality display. The dashed red lines represent the virtual image paths for the red sphere. B. Sequence of a single trial in experiment 1 (amplitude session). Each column corresponds to a subtrial (test movement sampling, reference movement sampling, choice) and each row to a different stage during the subtrial (black arrows indicate time progression). The yellow sphere is the cursor coinciding with the manipulator handle location, grey spheres are movement starting points, and blue and green spheres are movement targets. Yellow arrows (representing cursor movement) and the dashed lines (indicating the vertical offset between the 2 alternative movements) are shown for the purpose of illustration. The 2 movements differed in the resistive force generated by the haptic manipulator, in direction, and in either amplitude or duration, depending on the session. In the choice subtrial, the subjects were asked to choose the less effortful movement experienced during sampling by moving to the corresponding starting point in the “acquire fixation” stage (second row) and repeating this movement (movement 2 is chosen in this example). C. Example target locations in experiment 1 (amplitude session). The targets for the 2 alternative movements (green and blue spheres) were equidistant to the workspace center (the maximum distance to center was 100 mm). Horizontal offsets in the position of the starting points (upper and lower grey spheres) created the different movement amplitudes. In the choice subtrials, the middle grey sphere was used as an initial starting point: subjects then indicated their choices by going to the starting point corresponding to the movement they picked. D. Movement constraints in the amplitude and the duration session for experiment 1. Amplitudes correspond to the distance between the centers of the fixation sphere and the target sphere. Colors in the table header correspond to the actual target colors in the corresponding movements, which cued subjects on movement speed. In each trial, a test movement was pitted against a reference movement. E. Example target locations in experiment 2. Trials from experiment 2 were similar to experiment 1, except that the reference action consisted of 2 identical movement repetitions. The upper spheres (grey sphere and 2 blue spheres) represent the starting point and targets of the repeated movement. The 2 lower spheres represent the starting point and target of the single movement. As in experiment 1, subject indicated their choice by going from the middle grey sphere to the starting point of the chosen action (upper or lower grey spheres) F. Movement constraints in experiment 2.

