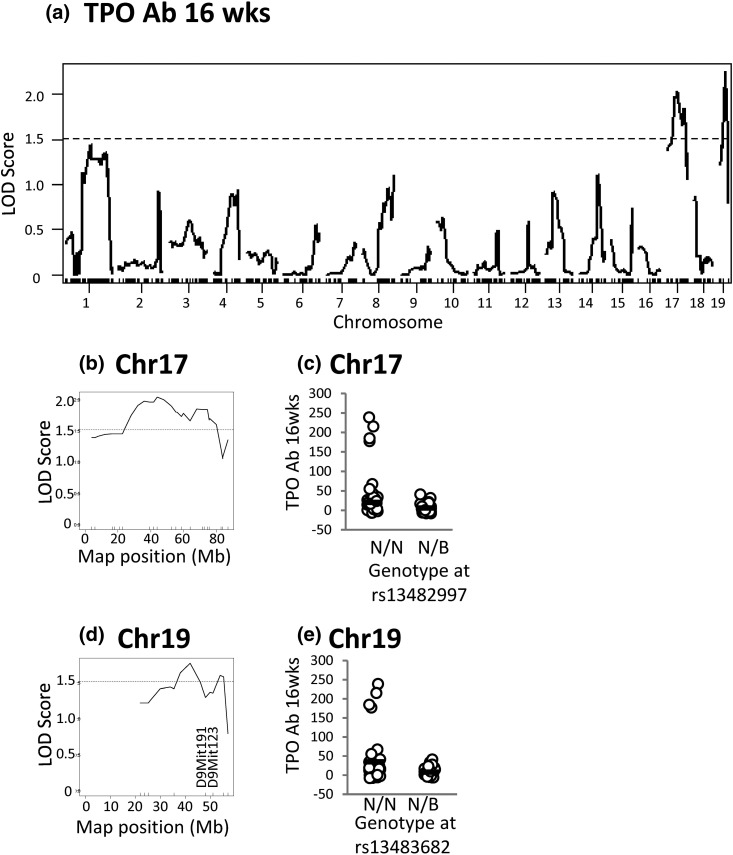
Figure 6.
Loci on chromosomes 17 and 19 are suggestively linked to TPOAb levels (16 weeks) in N2 mice. (a) Genome-wide LOD scores. (b) High-resolution map for chromosome 17. (c) TPOAb levels in mice segregated according to their genotype at rs13482997. (d) High-resolution map for chromosome 19. (e) TPOAb levels in mice segregated according to their genotype at rs13483682. For N2 genotypes N/N or N/B, N indicates NOD.H2h4, and B indicates BALB/c. The suggestive threshold is 1.51 (dotted lines).

