Figure 1.
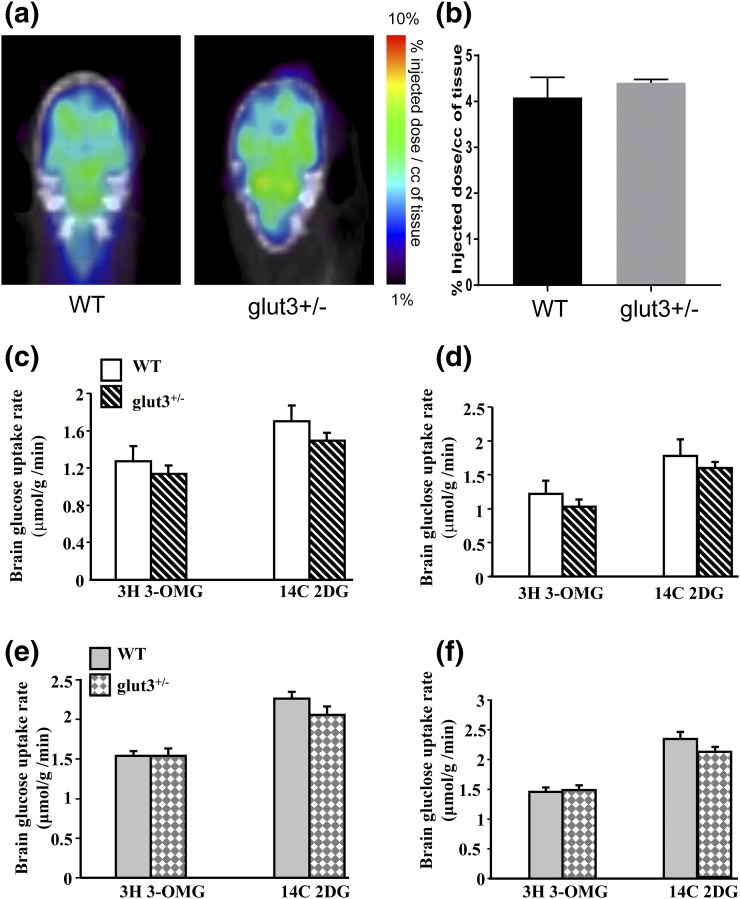
Brain glucose uptake. Positron emission tomography scan images (a) and radiotracer glucose uptake (b) in WT and glut3+/− mouse male cerebrum (c) and cerebellum (d) and female cerebrum (e) and cerebellum (f). *P < 0.05 vs WT. WT mice (male, n = 6; female, n = 6) and glut3+/− mice (male, n = 7; female, n = 7). Glut3-expressing testis (3-0-MG: glut3+/− = 0.3 ± 0.03 vs WT = 0.4 ± 0.08; 2-DG: glut3+/− = 0.4 ± 0.03 vs WT = 0.5 ± 0.07 µmol/g/min) also did not demonstrate a difference between the two genotypes.

