Figure 1.
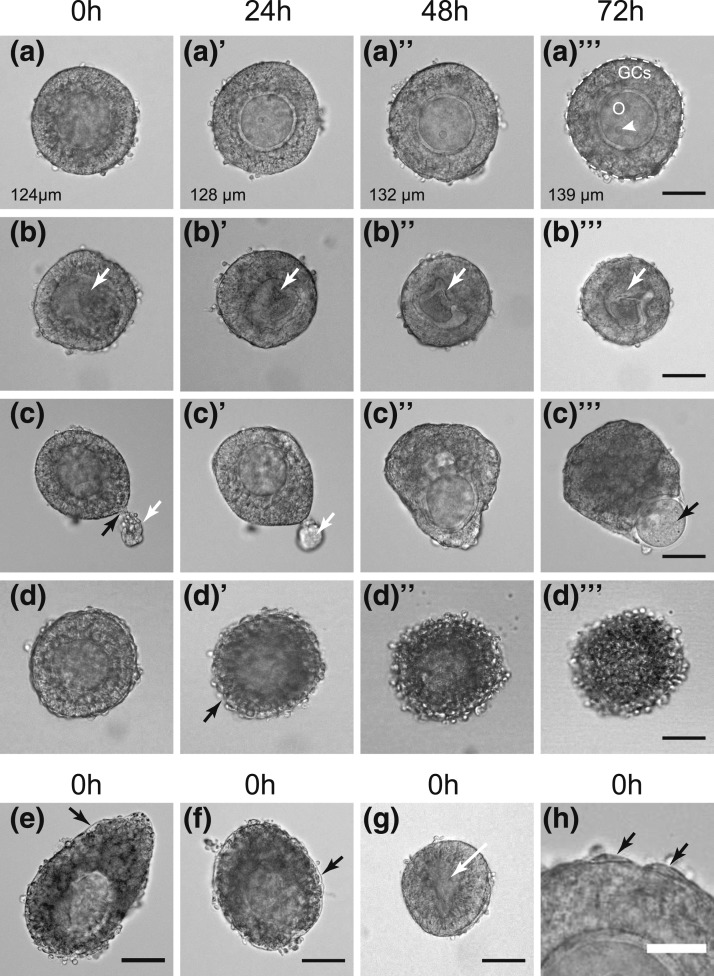
Morphology of manually isolated follicles that were included in the analysis (a; 84%) or excluded from analysis because of damage or atresia at the start of culture (b, c, e, f, and g; <15%) or onset of atresia during culture (d; <1%). (a) Healthy follicle cultured under control conditions (72 hours) with a central oocyte (O) and even layer of GCs. Follicle diameter shown in each image. The white dotted line (a’’’) indicates the basal lamina surrounding the GCs and shows the area that is measured. A nucleolus is arrowed (white arrowhead). Note the lack of theca cells on the basal lamina. (b) Follicle with indistinct oocyte (white arrow) that becomes increasingly misshapen and shrunken with time. (c) Follicle with damaged basal lamina (black arrow), resulting in extrusion of GCs (white arrow). With time in culture, the oocyte is extruded through the breach (black arrow). (d) Follicle that appears healthy at 0 hours but becomes atretic from 24 hours, with rounding up and progressive darkening of the GCs and loss of the basal lamina. (e and f) Atretic follicles at the start of culture (0 hours) with a detached basal lamina (black arrows) and darkened GCs. (g) Follicle with collapsing, indistinct oocyte (white arrow, 0 hours). (h) Sparse theca cells (black arrows) on basal lamina. Scale bars = 50 µm (a–g) and 25 µm (h).

