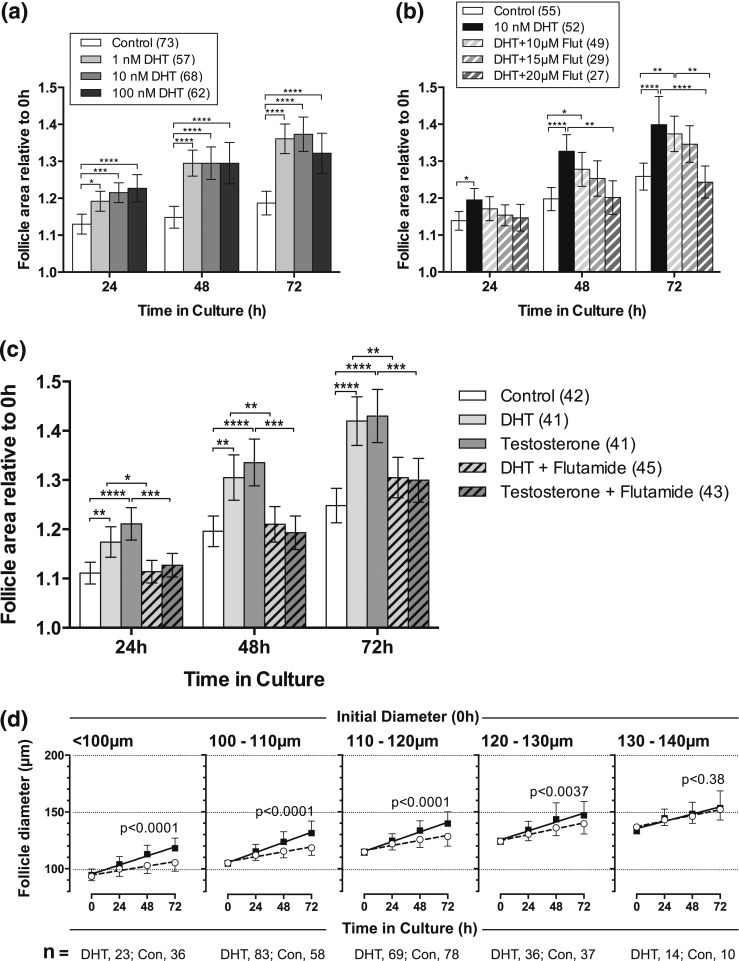
Figure 2.
Follicle growth in vitro in response to DHT and testosterone. (a) Response of individual follicles to increasing concentrations of DHT. The relative area of follicles in different treatments (area at timex/area at time0, where timex = 24, 48, or 72) was compared at each time point using one-way ANOVA with a Tukey’s multiple comparisons test. *P < 0.05, ***P < 0.001, ****P < 0.0001. Values are mean and 95% confidence interval. Numbers in parentheses are numbers of follicles. (b) Response of follicles to DHT (10 nM) in the presence of increasing doses of the AR inhibitor flutamide (Flut). Values are mean and 95% confidence interval. Statistical analysis as in a. *P < 0.05, **P < 0.01, ****P < 00001. (c) Response of follicles to DHT (10 nM) or testosterone (10 nM) in the absence and presence of flutamide (20 μM). DHT- and T-stimulated follicle growth was reversed by flutamide. Values are mean and 95% confidence interval. Statistical analysis as in a. *P < 0.05, **P < 0.01, ***P < 0.001, ****P < 00001. (d) Effect of DHT on in vitro growth of follicles of different initial sizes. Values are means and standard deviation, and lines are regression slopes. Slopes were compared using linear regression. Follicles larger than 130 µm in diameter at the start of culture did not grow more in the presence of DHT. Con, control.

