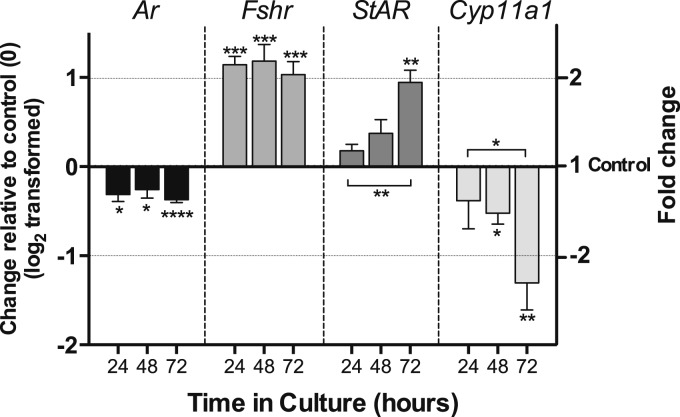
Figure 7.
Time course of hormone receptor and steroidogenic enzyme gene expression in isolated follicles during 72 hours of culture in the presence of DHT. Change in expression of Ar, Fshr1, Star, and Cyp11a1 in four to six samples of five follicles, each cultured for 24, 48, and 72 hours in the presence of 10 nM DHT. Data have been log2 transformed, and DHT treatment was compared with time-matched control samples (0) and between time points using an unpaired t test. Fold change is indicated in right-hand y axis. Asterisks by error bars indicate significant difference in expression from control, and differences between time points are indicated by asterisks on horizontal lines. *P < 0.05, **P < 0.01, ***P < 0.001, ****P < 00001. Values are mean and SEM.

